
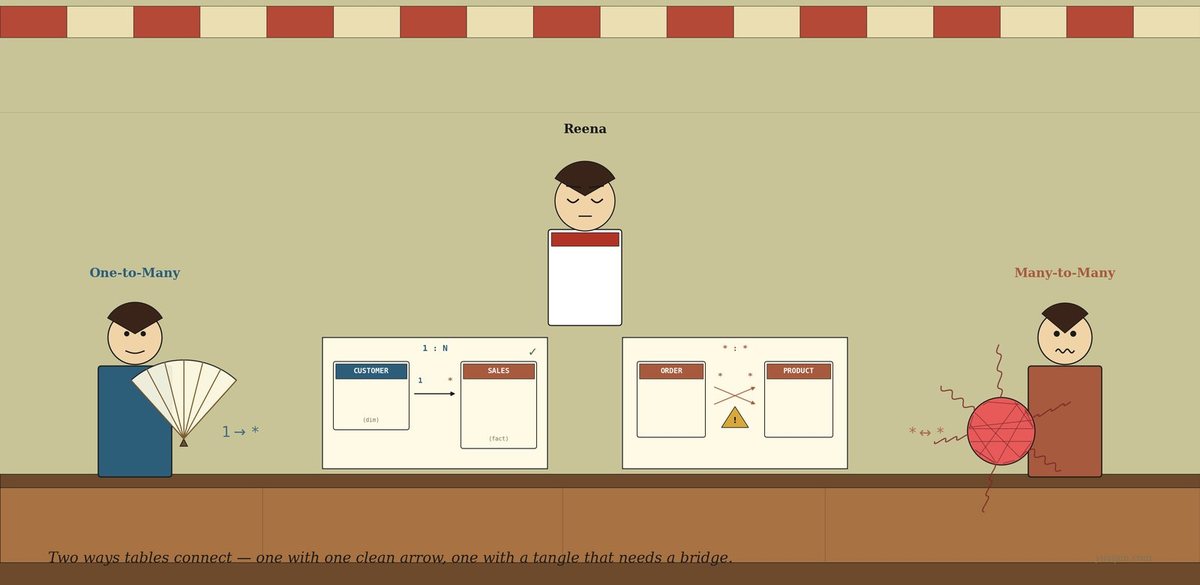
It’s a quiet morning. The kettle is just starting to hiss. The ceiling fan turns slowly above. Reena is at her counter with two paper schemas spread out in front of her — drawn for tomorrow’s meeting with her cousin, who has asked for a small Power BI report on her thirty-day notebook.
The first paper, on her left, shows two boxes labelled CUSTOMER and SALES with a single arrow between them. “That one’s clean,” her cousin had said yesterday. “Each customer has many sales. Each sale has one customer. Move on.”
The second paper, on her right, shows two boxes labelled ORDER and PRODUCT with arrows criss-crossing between them, and at the centre — a small yellow triangle with an exclamation mark. Power BI drew the triangle. Reena does not know what it means.
She mutters, “Same arrow shape. Why does the second one complain?”
The awning rustles.
A woman steps in under the awning — calm, unhurried, holding a small wooden hand-fan opened out: one handle at the bottom, many ribs fanning up. She places it lightly on the counter, where it props up beautifully like a peacock’s tail. She says, “I am One-to-Many. The clean default. One parent, many children. Each child knows exactly who its parent is.”
A man steps in behind her — slightly flustered, hair a little wild, holding a red ball of yarn with threads sticking out at all angles, threads crossing through the middle, knots visible on the surface. He sets it carefully on the counter as though afraid it might unravel further. He says, “I am Many-to-Many. Both sides repeat. I exist when one row on one side connects to many rows on the other — and the other way around too. Power BI doesn’t trust me without help.”
Reena looks at them, looks at her papers, and asks, “Which one of you do I need?”
They reply in unison: “The first paper is her. The second paper is me.”
One-to-Many tries first
One-to-Many flips Reena’s left paper toward herself. She points at the small CUSTOMER box and the larger SALES box. She says, “This is a cardinality of one-to-many — one on the customer side, many on the sales side. The shape of the relationship.”
She fans out her hand-fan. “One handle, many ribs. Each rib is a sale. They all join back to the same handle — Asha. If you filter the report by Asha, you see her three sales. If you filter by sale s3, the report shows you Kumar — exactly one customer, no ambiguity.”
Reena says, “And Power BI is happy with this?”
“Happy and fast. The default filter direction — the way filtering propagates through the relationship — is single, from the one side to the many side. There is no path back the wrong way, so no confusion.”
Reena pulls the right paper closer. “And this one?”
One-to-Many’s smile fades a little. She says, “That is not me.”
Many-to-Many tries
Many-to-Many sets his ball of yarn carefully in the middle of the right paper. He points at the ORDER box on the left of the schema, then at the PRODUCT box on the right. He says, “Each combo order has many products — tea and samosa and biscuit. And each product is in many orders — samosa is in dozens of combos. Both sides repeat. The keys collide.”
He picks up the yarn ball and holds it close to his chest. “I am useful. The relationship really exists in your data. But Power BI cannot tell which side a filter should flow toward — both sides are ‘many’. So it draws that yellow triangle, and your aggregations become ambiguous. SUM may double-count. AVERAGE may average over the wrong rows. CALCULATE may quietly do something you did not ask.”
Reena frowns. “Then what?”
He sets the yarn ball down and reaches into his coat pocket. He pulls out a small wooden plank and lays it gently on the right paper, between ORDER and PRODUCT. “There are two ways out. The first one is this.” He taps the plank. “A bridge table. A small in-between table that turns one many-to-many into two clean one-to-many relationships.”
He explains, slowly:
Order → OrderItems ← Product
Each row of OrderItems is one product on one order. Order has many OrderItems. Product has many OrderItems. Both sides of the bridge are clean 1:N. Power BI’s yellow triangle goes away, filtering becomes unambiguous, and aggregations stop double-counting.
Reena says, “And the second way?”
He winces. “Set the cardinality directly to *:* in Power BI’s relationship pane. It works — Microsoft added this in 2018. But the warning lights stay on. You’ll have to think about filter direction — single or both — every time you write a measure. Most analysts use the bridge table when they can.”
What just happened
Reena pours herself a glass of tea for the first time all morning, sits down on her own counter, and says, “So both of you describe how tables connect. But you” — she points at One-to-Many — “are the default. And you” — to Many-to-Many — “are the messy middle child who needs a plank to behave.”
Both nod.
One-to-Many adds, “Most relationships in any honest data model should be me. Customer → Sales. Date → Sales. Region → Customer. Star schema first — your cousin keeps saying that to you because in a star schema, every relationship from a dimension to the fact table is one-to-many. Many-to-many shows up only when the data genuinely insists.”
Many-to-Many sighs. “And when it does insist, give me the bridge plank. Or live with the warnings. Either is fine — but please don’t pretend I’m one of her. Pretending I’m 1:N when I’m really : is how you end up with a report that looks correct and isn’t.”
Reena nods slowly. “Star schema first. Bridge table when the data really repeats. Direct : only when neither is possible.”
The same chat, in a chart
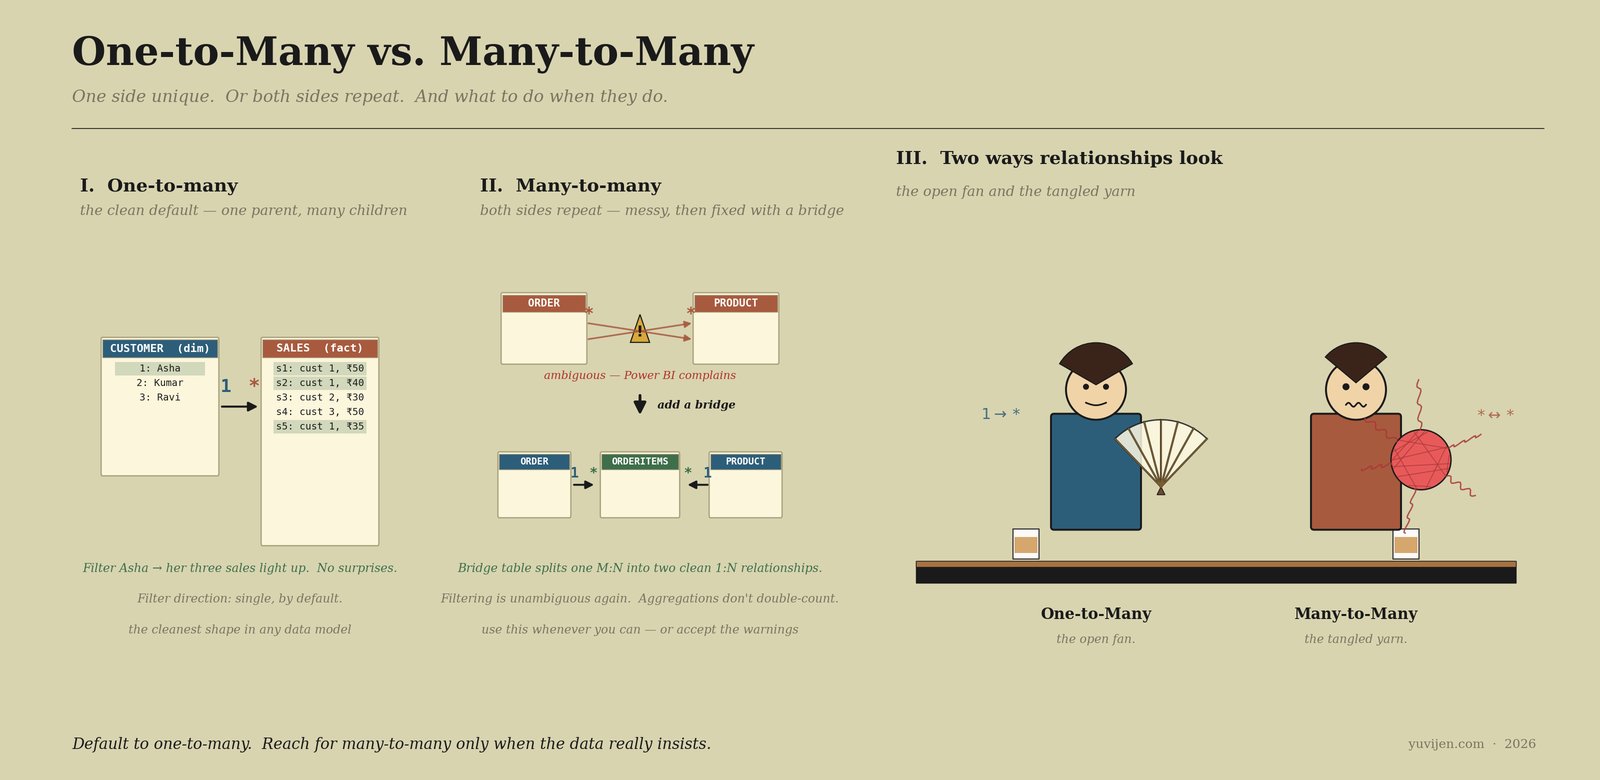
That picture is exactly the same conversation, drawn. The first panel shows Customer → Sales with Asha’s row and her three sales rows highlighted in green — clean filtering. The second panel shows the same Order ↔ Product mess with the yellow warning, and below it, the resolved schema with a bridge table cleaning everything up. Same data, two different ways to model it.
One last warning before they leave
Many-to-Many puts the yarn ball back into his bag and the wooden plank back into his coat. He says, “One thing, Reena. The most common bug I see — the one that ruins reports — is double-counting.”
Reena says, “Double-counting?”
He nods. “Suppose Asha shares a loyalty card with her sister Priya. The card has two customer-ids on it. Now if you naively connect Customer ↔ LoyaltyCard as a : with bidirectional filter, and you ask for SUM(Sales) filtered by card, Asha’s ₹1,000 of sales gets counted once for her own card and once for the family card. Total: ₹2,000. Your cousin will write you a stern email.”
He taps the plank. “The bridge table prevents this. Each Sales row has one customer-id. The bridge maps customers to cards explicitly. The aggregation goes through the bridge, no row gets counted twice.”
One-to-Many adds, “And don’t also fix the warning by switching the filter direction to both without thinking. Bidirectional filters can introduce ambiguity loops in your model — slow performance, weird CALCULATE results, and that same yellow triangle popping up on relationships you thought were fine.”
Reena nods slowly. “Bridge table. Single filter direction. Don’t trust silence — if Power BI shows a warning, the warning is real.”
Many-to-Many says, “If the data really repeats — give me the plank.”
One-to-Many says, “If it doesn’t — just leave me alone.”
Quick gut-check
You’re modelling your tea stall data in Power BI. Three relationships are needed.
- Customer → Sales — each sale has exactly one customer; each customer has many sales.
- Order ↔ Product — each combo order has many products; each product appears in many orders.
- Customer → Region — each customer lives in exactly one home region; each region has many customers.
Which is one-to-many? Which is many-to-many? And what would you do about (2)?
1 and 3 are one-to-many — a single arrow, default filter direction. (2) is many-to-many. Resolve it with a bridge table — OrderItems — where each row is one product on one order. That gives you Order → OrderItems ← Product as two clean 1:N relationships, and SUM(amount) stops double-counting.
The bill
Reena closed her two schema papers with a small smile. She added a new sheet to the second paper — labelled OrderItems — slotted between Order and Product. The yellow triangle on her Power BI canvas blinked off. Aggregations behaved. The cousin would be pleased on Sunday.
The fan ticked. The kettle hissed. One-to-Many folded her hand-fan, tucked it neatly into her sleeve, and walked back out under the awning. Many-to-Many wound his loose yarn back into the ball, tucked the wooden plank under his arm, and followed.
Use them together. Default to one-to-many for almost everything. Reach for many-to-many only when the data really repeats — and when you do, give it a bridge.
For the dashboard-curious
Power BI relationship cardinalities are
1:1,1:*,*:1, and*:*. The*:*direct option came in 2018; before that, every many-to-many had to be modelled with a bridge table. Cardinality lives in the Manage relationships dialog or on the relationship line itself in the model view. Each relationship also has a filter direction — single (the default, recommended) or both (use sparingly, mainly for dimensions that need to filter each other through a shared fact).Tableau does not show cardinality as explicitly. Its newer relationship model (the noodle) infers cardinality from the data and warns you the same way when joins are ambiguous. Older joins (LEFT/INNER/FULL) handle many-to-many by row multiplication — the same double-counting trap, just expressed differently.
Same shapes. Different houses.