
It’s a quiet morning. The kettle is just starting to hiss. The ceiling fan turns slowly above. Reena is at her counter with her thirty-day notebook open. Sales in one column, costs in another, days down the side.
Her cousin is coming on Sunday. Last week he asked her one new thing: “Add a Profit number, Reena. Sales minus cost, every day. I want to see it.” Then, because he is who he is, he added the warning: “Two ways to do that. Pick wrong and your report will either be slow, or it will not answer the question I actually ask.”
She has no idea what that means. She scratches her head with the chalk.
She mutters, “Profit is just sales minus cost. How can there be two ways?”
The awning rustles.
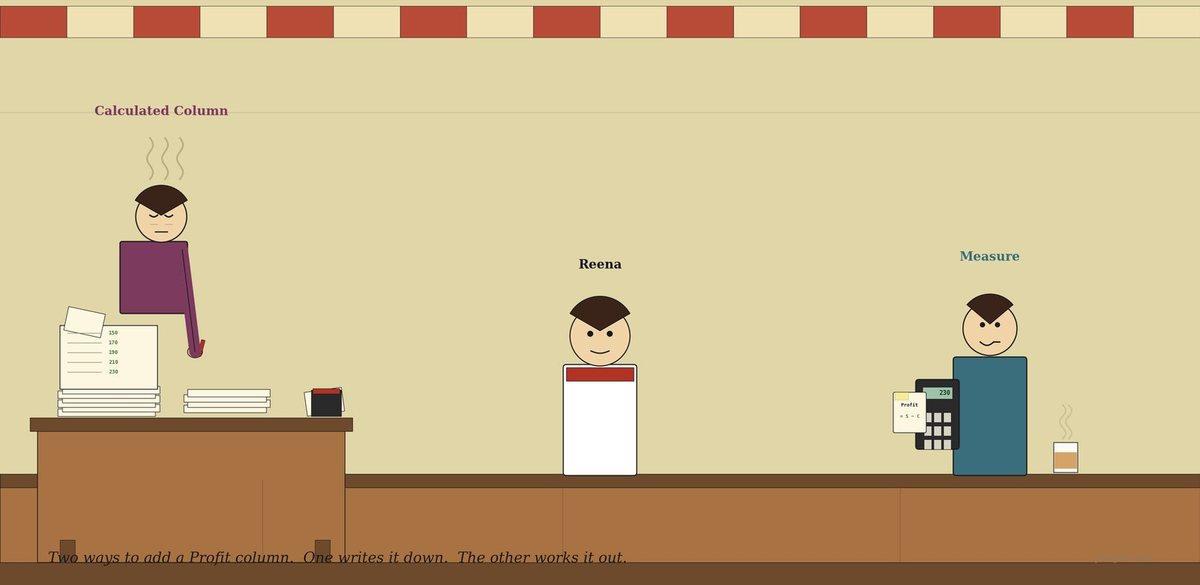
A woman steps in under the awning — methodical, slightly tired, carrying a thick clipboard and trailing the smell of fresh ink. Her right hand is visibly cramped. She sets the clipboard on the counter and the top page is already covered in writing: Mon 150. Wed 190. Thu 170. Fri 230. Sat 230. “I am Calculated Column,” she says. “I have already done it. Every row of your notebook has its Profit value. Written. Stored.”
A man strolls in behind her — calm, in no apparent hurry, holding a small handheld calculator in his shirt pocket. A tiny chit of paper is taped to the back of it, and the chit reads simply Profit = Sales − Cost. He has not written anything. He pours himself a glass of tea, settles against the counter, and says, “I am Measure. I have not done anything yet. I have only the formula. Press the buttons and I’ll do it now.”
Calculated Column glares. “I have written four pages.”
Measure shrugs. “Yet we will give the same answer.”
Reena looks between them. “Which one of you do I need?”
They reply in unison: “Both. But mostly him.”
Calculated Column tries first
Calculated Column flips her clipboard around and slides it across the counter to Reena. She says, “Look. Mon: Profit 150. Wed: Profit 190. Thu: Profit 170. Each day already done. Each row of your notebook has its own value, in its own little jar.”
Reena says, “Tidy. So when my cousin says ‘Profit on Friday,’ you just point to Friday’s row?”
“Pre-computed. Stored. No work needed.”
Reena nods. “And what if a sale gets corrected? If Friday’s sales were actually 420, not 410?”
Calculated Column hesitates. She says, “Then I rewrite Friday’s Profit. By hand. And every other row that referenced it.” Her eyes flicker. Her hand twitches.
Reena says, “How big does the notebook get?”
“Bigger. One Profit value per row. Forever. The notebook fattens by the size of all the values I have written.”
A small steam-curl of frustration rises above Calculated Column’s head.
Measure tries
Measure sets his calculator on the counter and slides his recipe card forward.
He says, “I have not added a Profit column. Your notebook stays exactly the size it was. The only thing I have added is the formula card: Profit = Sales − Cost.”
Reena asks, “And the answer?”
He turns the calculator on. “What do you want the answer for?”
“Today’s profit.”
He punches in 380 (today’s sales) − 150 (today’s cost) = and shows the screen. 230.
“This week’s profit?”
He punches in 1,640 − 670 = and shows the screen. 970.
“What if my cousin wants Tuesday only?”
He shrugs. “There is no Tuesday — the stall was closed. Filtering to Tuesday gives me nothing to add up. Display: zero.”
Reena says, slowly, “So you have one formula and three different answers depending on what is being asked.”
“Same recipe. Different filter. Fresh answer every time.”
Calculated Column looks slightly betrayed. “He is not even writing it down.”
Measure says kindly, “Yes — but that is the whole point. If your sales for Friday change tomorrow, I do nothing. The next time anyone asks for Friday’s profit, I press the buttons fresh. You” — he nods at her — “would have to rewrite four lines of your clipboard and then the cousin’s report.”
What just happened
Reena pours herself a glass of tea for the first time all morning, sits down on her own counter, and says, “So you both compute Profit. But you” — she points at Calculated Column — “do it once, in advance, and store it. And you” — she points at Measure — “wait until someone asks, and compute it on the spot.”
Both nod.
Reena asks, “And in my cousin’s textbook?”
Measure says, “What I do is called a measure in Power BI, or an aggregate calculation in Tableau. I work in the filter context of whichever visual is asking — today, this week, this region. The formula stays the same. The filter changes. The answer changes.”
Calculated Column says, “What I do is called a calculated column. I work in the row context of the table — for each row, I look at that row’s sales and that row’s cost, and I write down that row’s profit. Once. Stored. Forever, until the data refreshes.”
Reena nods slowly. “Row context for you. Filter context for him.”
Measure adds, “And if your dataset is big, I am cheaper. I take no extra storage — only the formula. Your friend here doubles the column count of every table she touches.”
Calculated Column glares again. “But I am instant. I have already computed. He has to compute every time someone presses a button.”
Measure sips his tea. “On a thirty-row notebook, that is one millisecond.”
The same chat, in a chart
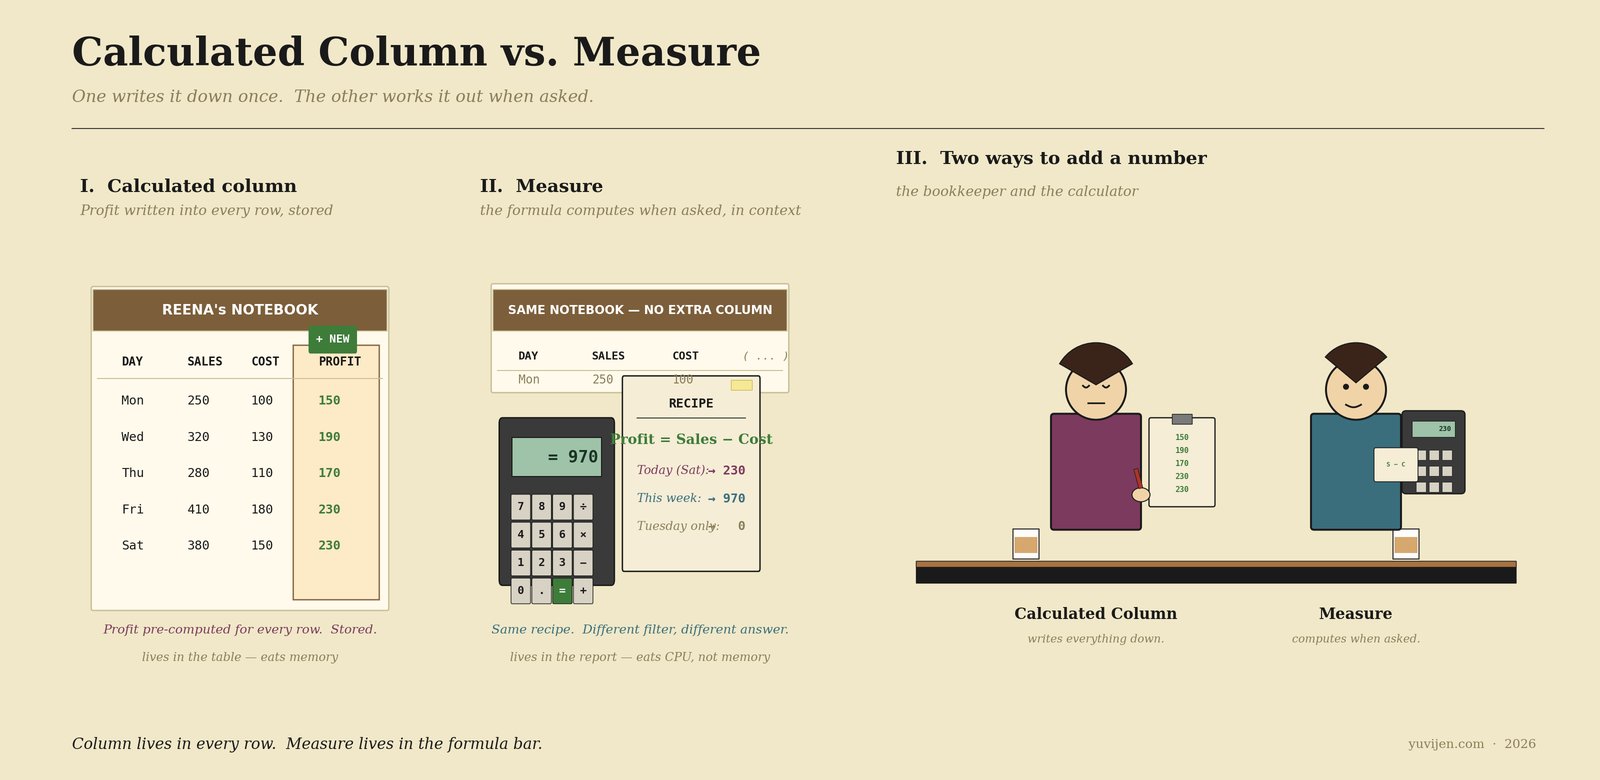
That picture is exactly the same conversation, drawn. The first table has a new green Profit column with one stored value per row. The second table is unchanged — but a calculator beside it shows the formula Profit = Sales − Cost and three different filtered totals coming out of the same recipe. Same notebook, two different ways to add a number.
One last warning before they leave
Calculated Column packs up her clipboard. She says, “One thing, Reena. Don’t ask me to do percentages or running totals. That needs to know what is being filtered, and I cannot — I only see one row at a time. Try and ask me for % of total sales and I will write the same number in every row, like a fool.”
Measure puts away his calculator. He says, “And don’t ask me for things that need to live as a row attribute. Customer’s category is a label, not a sum. If it is not an aggregation, I cannot do it.”
Reena nods slowly. “Aggregations and percentages — for you, Measure. Per-row labels and fixed values — for you, Calculated Column.”
Calculated Column says, “Per row. Always.”
Measure says, “Aggregated. Always.”
Quick gut-check
You’re building a small Power BI report off your shop’s transaction table. Three new fields are requested.
- “The product’s brand — Britannia, Parle, Amul.”
- “The percentage of total sales each transaction represents.”
- “Today’s gross margin (sales − cost) summed across the store.”
Which is a calculated column, and which is a measure?
1 is a calculated column — it is a per-row label that joins to the product. 2 and 3 are measures — they need filter context (the percentage changes when you slice; the gross margin changes when you change the date range). When in doubt, ask: “does the answer change if I change the filter?” If yes → measure. If no → calculated column.
The bill
Reena closed her notebook with a small smile. She marked Profit as a measure on a small chit and stuck it next to the cash box. She left Customer Tier for tomorrow — that one would be a calculated column, since each customer either is “regular” or “occasional” and that does not change when you filter by date.
The fan ticked. The kettle hissed. Calculated Column packed up her clipboard and left to go pre-write someone else’s afternoon. Measure took his glass of tea, his calculator, and his three-line recipe card and stayed for another round.
Use them together. Calculated Column for fixed, per-row attributes. Measure for anything that needs to react to the filter. One eats memory. The other eats CPU. Pick wrongly and either your report runs slow or it answers the wrong question — exactly what the cousin warned about.
For the dashboard-curious
Power BI: Modeling → New column creates a calculated column (DAX, evaluated row-by-row at refresh, stored in the model). Modeling → New measure creates a measure (DAX, evaluated at query time in the visual’s filter context, not stored).
Tableau: a row-level Calculated Field (no aggregate function) behaves like a calculated column. A Calculated Field that uses an aggregate function —
SUM(Sales) − SUM(Cost)— behaves like a measure.
Same idea. Different houses.